Annual Weather Review, 2024
Issued: 1 January 2025
On this page:
Summary
Analysis
Meteograms
Records
Monthly Reviews
Notes
Summary
Total rainfall for the year was 411.7 mm. The highest daily rainfall was 56.3 mm on April 2.
Maximum temperatures varied from a low of 10.4° C on July 6 to a high of 40.8° C on December 16.
Minimum temperatures varied from a low of -0.5° C on July 4 to a high of 24.1° C on February 22.
Analysis

Top of page 
Meteograms
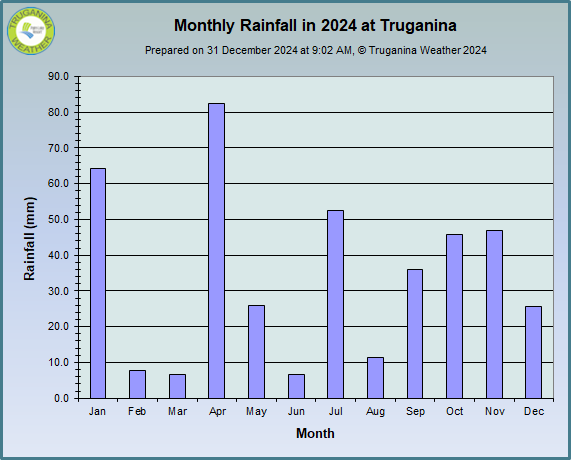


Click on a graph to see the yearly data
Top of page
Records
January
Nil
February
The mean maximum temperature of 27.0° C is a new record for the warmest February mean maximum temperature. The previous record was 26.9° C in 2018.
There were 9 days over 30° C in February. The previous record was 7 days in 2018.
There were 6 days over 35° C in February. The previous record was 3 days in 2019.
March
The total rainfall of 6.6 mm is a new record for the lowest March total rainfall. The previous record was 7.8 mm in 2019.
The maximum temperature of 38.9° C on the 9th supersedes the record for the warmest March maximum temperature. The previous record was on 1 March 2019.
The mean maximum temperature of 25.2° C supersedes the record for the warmest March mean maximum temperature. The previous record was in 2019.
The 6 days over 30° C is a new record for the most days in March over 30° C. The previous record was 5 days was in 2019.
The 3 days over 35° C supersedes the record for the most days in March over 35° C. The previous record was in 2019.
The mean sea level pressure of 1032.1 hPa on the 21st is a new record for the highest March pressure. The previous record was 1031.2 hPa on 20 March 2018.
April
The mean maximum temperature of 19.3° C is a new record for the coolest April mean maximum temperature. The previous record was 19.4° C in 2020.
May
Nil
June
The total rainfall of 6.7 mm is a new record for the lowest June total rainfall. The previous record was 11.8 mm in 2017.
The mean maximum temperature of 14.3° C is a new record for the coolest June mean maximum temperature. The previous record was 14.4° C was in 2022.
July
The total rainfall of 52.5 mm is a new record for the highest July total rainfall. The previous record was 37.7 mm in 2022.
The maximum temperature of 10.4° C on the 6th is a new record for the coolest July daily maximum temperature. The previous record was 10.9° C on 11 July 2018.
The mean temperature of 5.5° C on the 3rd is a new record for the coolest July daily mean temperature. The previous record was 5.8° C on 20 July 2022.
The mean maximum temperature of 13.7° C is a new record for the coolest July mean maximum temperature. The previous record was 13.9° C in 2022.
The mean sea level pressure of 1043 hPa on the 6th is a new record for the all-time highest pressure. The previous record was 1038.3 hPa on 1 June 2017.
August
The total rainfall of 11.3 mm is a new record for the lowest August total rainfall. The previous record was 20.5 mm in 2023.
The maximum temperature of 25.1° C on the 25th is a new record for the warmest August daily maximum temperature. The previous record was 22.3° C on 22 August 2021.
The minimum temperature of 14.8° C on the 16th is a new record for the warmest August daily minimum temperature. The previous record was 13.1° C on 4 August 2023.
The mean temperature of 17.6° C on the 25th is a new record for the warmest August daily mean temperature. The previous record was 16.6° C on 30 August 2020.
The mean maximum temperature of 18.7° C is a new record for the warmest August mean maximum temperature. The previous record was 16.6° C in 2021.
The mean minimum temperature of 8.2° C is a new record for the warmest August mean minimum temperature. The previous record was 7.5° C in 2023.
The mean sea level pressure of 1037.2 hPa on the 1st is a new record for the highest August pressure. The previous record was 1035.9 hPa on 6 August 2023.
September
The maximum temperature of 11.6° C on the 14th is a new record for the coolest September daily maximum temperature. The previous record was 11.8° C on 25 September 2020.
The mean minimum temperature of 9.2° C is a new record for the warmest September mean minimum temperature. The previous record was 9.0° C in 2020.
The mean sea level pressure of 1038.9 hPa on the 15th is a new record for the highest September pressure. The previous record was 1035.9 hPa on 11 September 2023.
October
The 32.3 mm of rain on the 19th is a new record for the highest October daily rainfall. The previous record was 27.8 mm on 22 October 2022.
The mean minimum temperature of 10.7° C is a new record for the warmest October mean minimum temperature. The previous record was 10.6° C in 2017.
November
The mean temperature of 29.9° C on the 23rd is a new record for the warmest November daily mean temperature. The previous record was 29.4° C on 30 November 2017.
December
The mean maximum temperature of 26.9° C is a new record for the warmest December mean maximum temperature. The previous record was 26.1° C in 2018.
Top of page
Monthly Reviews


Click on a image to see the monthly review
Top of page
Notes
- Unless otherwise stated, temperature is given in degrees Celsius (° C), rainfall in millimetres (mm) and pressure in hectopascals (hPa).
- Our long-term averages and station records are based on all available data since 1 April 2017. All annual data are based on complete calendar years commencing in 2018.
- If a station record is equalled, the record passes to the most recent date to conform to standard BoM practice.
- Anomoly is the difference between the recorded value and the long-term monthly average.
- For most meteorological elements, the mean is the standard measure of the average.
- For rainfall, the median is the preferred measure of the average, particularly if there is a small volume of data.
- Refer to our observing program for details about the observation period for each element and how the data are stored.
Top of page
[ back ]