Annual Weather Review, 2019
Issued: 1 January 2020
On this page:
Summary
Meteograms
Reviews
Notes
Summary

Top of page ![]()
Meteograms


Click on a graph to see the yearly data
Top of page ![]()
Reviews
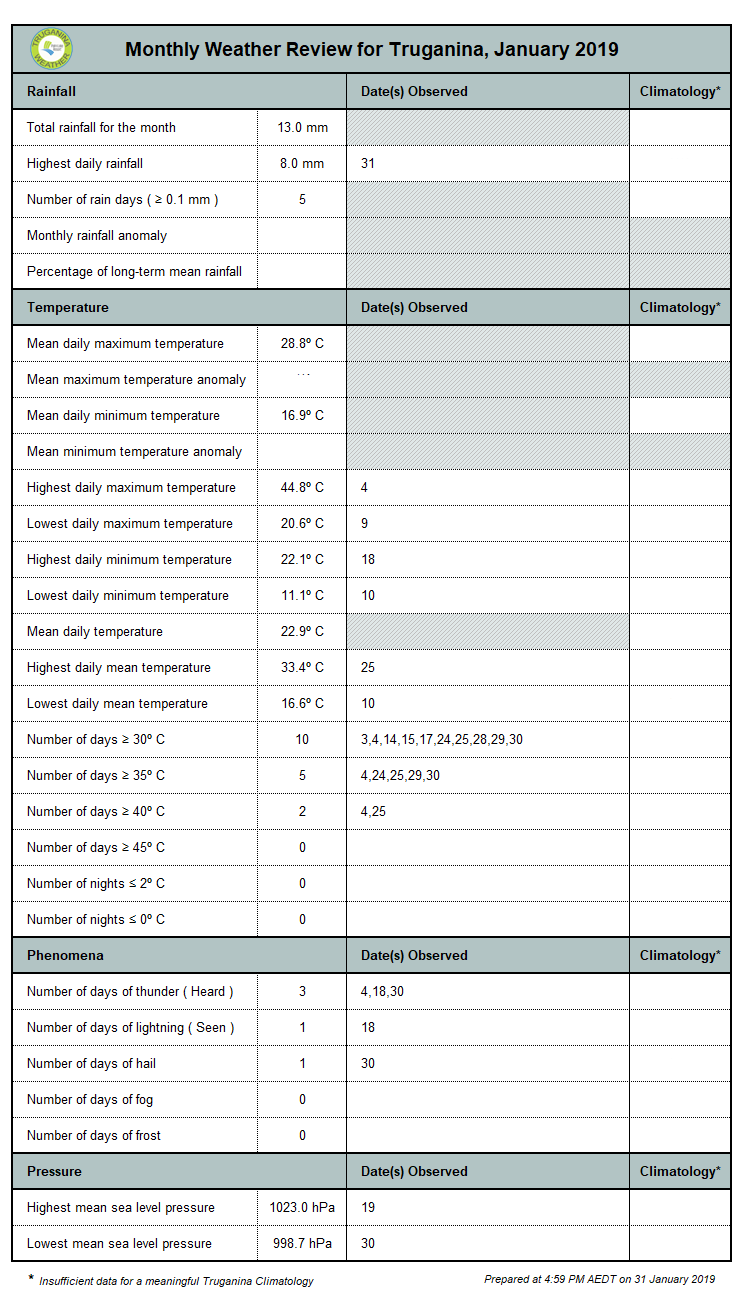


January February March April


May June July August


September October November December
Click on a image to see the monthly review
Top of page ![]()
Notes
Units of Measurement
Unless otherwise advised, temperature is given in degrees Celsius (° C) and rainfall in millimetres (mm).
Observation Times & Reporting Periods
The main observation for the day is at 9 am when the precipitation over the past 24 hours is determined, and the maximum and minimum thermometers are also read and reset. The following conventions are used for assigning dates to the observations made:
- Maximum temperature : the 24 hours from 9 am on the date the data are recorded. The maximum temperature will usually occur in the afternoon of that day.
- Minimum temperature : the 24 hours to 9 am on the date the data are recorded. The minimum temperature will usually occur in the morning of that day.
- Mean temperature : the average of the daily maximum and minimum temperatures on the date the data are recorded.
- Daily rainfall : the 24 hours to 9 am on the date the data are recorded. A significant portion of the rain may have occurred on the previous calendar day.
- Monthly rainfall : from 9 am on the last day of the previous month to 9 am on the last day of the current month.
- Phenomena : the 24 hours to midnight on the date the data are recorded.
Climatology & Station Records
Our climatology and station records are based on all available data since 1 April 2017. All annual data are based on complete calendar years commencing in 2018. If a station record is equalled, the date shall be the most recent occasion to conform to standard BoM practice.
Note: Anomaly is the observed value minus cliimatology.
Top of page ![]()
[ back ]